

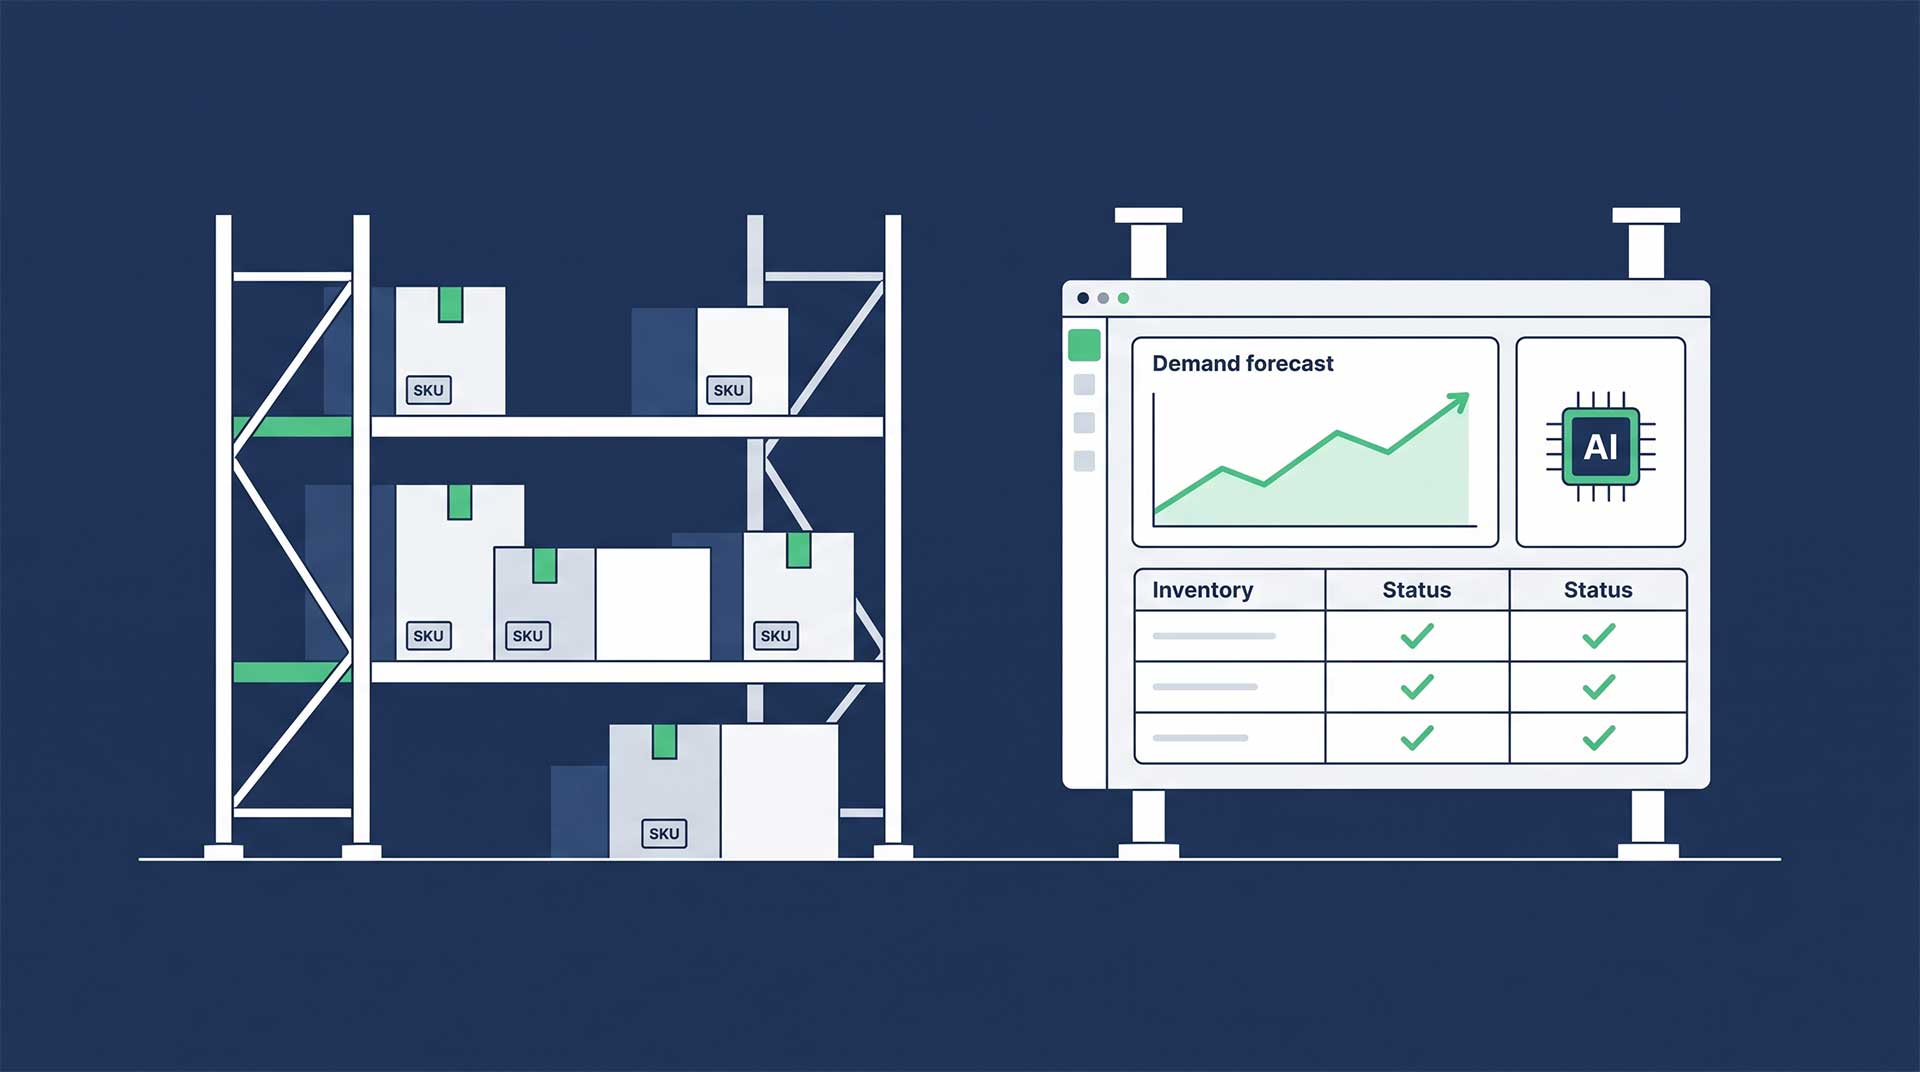
Why forecasting is harder for a distributor than it looks from the outside
Most of the AI forecasting content you'll find is written for retail or for enterprise manufacturers. Distribution has a few wrinkles that make forecasting a bit harder:
- SKU count and location count multiply against each other. A retailer forecasts a few hundred items per store. A mid-market distributor can be forecasting tens of thousands of SKU-location combinations, many of them slow-moving or intermittent.
- Margins leave no room for error. When your margin is in the single digits, a 10% forecasting miss could be the difference between a profitable quarter and a flat one.
- Supplier lead times and minimum order quantities don't flex. A forecast that doesn't account for a 12-week lead time on a key SKU isn't useful, no matter how statistically sound it is.
- Demand isn't always consumer-driven. It's shaped by contractor schedules, project timelines, seasonal trade work, and capital equipment cycles, patterns that don't behave like retail seasonality.
- Cost volatility has gotten worse. Tariff-driven prices and shifting landed costs scramble the reorder math that used to be stable from year to year.
- Most planning still runs on spreadsheets and institutional memory, which means the knowledge of why an order pattern looks the way it does often lives in one person's head.
What this looks like in practice
Here's a composite picture based on patterns we see repeatedly across distribution clients. (This is not a single real account, but a realistic illustration of how things often work.)
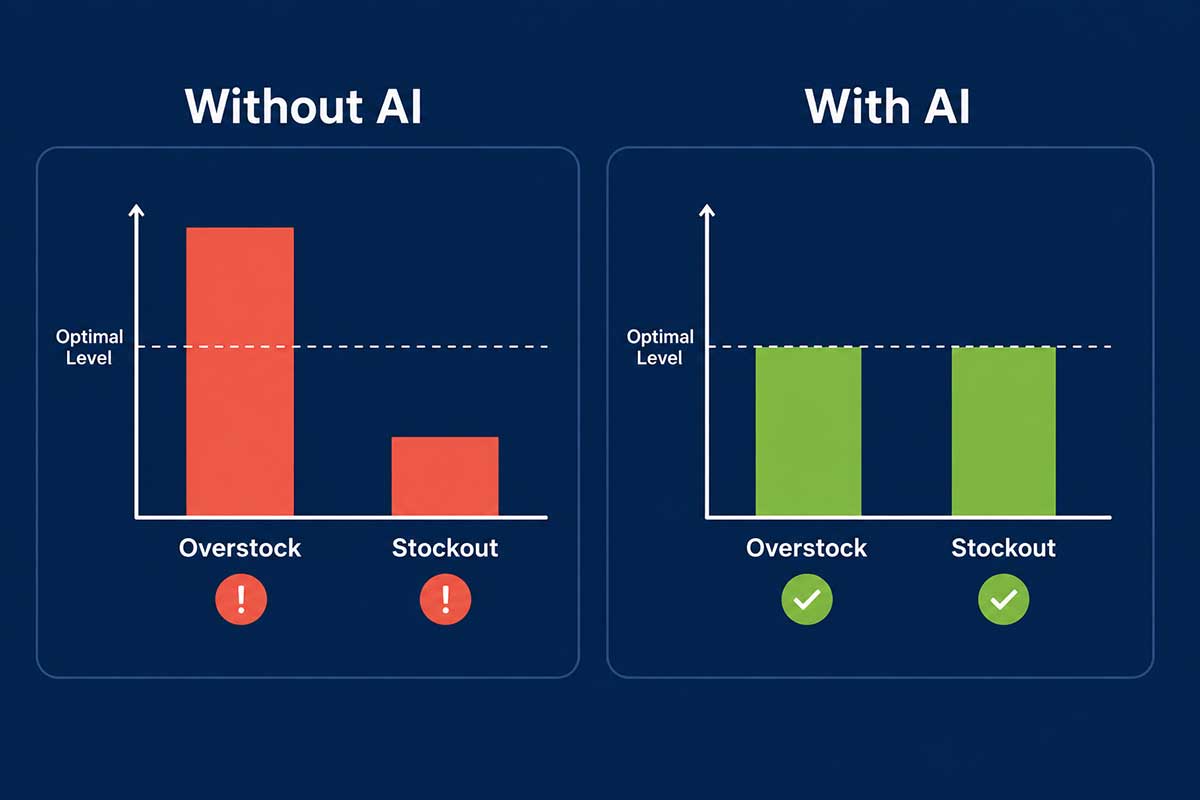
Picture a mid-market industrial distributor carrying around 15,000 active SKUs across three warehouses. One planner handles forecasting for several thousand of those SKUs, mostly by extending last year's sales forward and adjusting by feel for whatever's changed. Two patterns repeat every year: a high-volume fastener and fitting line gets quietly overstocked because the planner pads orders to avoid a stockout, and a narrower, higher-margin specialty line backorders every fourth quarter because its demand is concentrated in a six-week window that a flat annual average doesn't capture.
A forecasting model trained on clean historical, lead-time, and seasonality data catches both patterns on its own: it tightens safety stock on the fastener line because the demand there is actually stable enough not to need the padding, and it pre-positions inventory on the specialty line three weeks ahead of the Q4 window because it has seen that pattern repeat in prior years. Neither fix requires a new hire or a new platform. It requires a forecasting layer that's looking at the data the way a planner would if they had unlimited time to study every SKU, every cycle.
That's the realistic shape of the McKinsey numbers cited above: not one dramatic win, but a series of small, compounding corrections across thousands of SKUs that a person managing the whole catalog manually will never have time to catch.
What actually changes with AI demand forecasting, and what doesn't
AI forecasting isn't a replacement for your planners. It's a way to let the model handle the volume and let your team handle the judgment calls that actually need a human.
The numbers are real, but they assume your data is ready
The inventory, logistics, and procurement gains cited above are achievable. They show up consistently across McKinsey's research on AI in distribution operations. But they're not automatic. Every one of those gains assumes the model has clean, consistent data to learn from. That's the part most distributors underestimate.
Here's the gap, in plain terms: a 2026 survey of more than 400 distribution leaders by NAW and Modern Distribution Management found that 73% expected measurable results from AI, but only 16% had actually achieved them. The appetite is there. The execution plan usually isn't.
That gap isn't a technology problem. It's almost always a data problem: sales history that isn't clean, inventory records that don't tie back to actual fulfillment locations, item masters cluttered with duplicates and dead SKUs, and promotions or one-time events that were never flagged separately from normal demand. A forecasting model trained on that kind of data will produce confident-looking numbers that are wrong in ways nobody catches until the inventory report does.
A data-readiness checklist for distribution forecasting
Before you evaluate any AI forecasting tool or module, it's worth running your own data through a short readiness check. If you can't answer “yes” to most of these, that's where the real work starts, not in the AI itself.
- Do you have at least 18–24 months of clean transaction history for each SKU at each location?
- Are promotions, stockouts, and one-time demand spikes flagged separately from normal sales in your data, rather than blended in as if they were typical demand?
- Can you tie sales and inventory data to the specific warehouse or branch that fulfilled the order, not just a company-wide rollup?
- Do you know supplier lead times at the SKU level, not just a general assumption by vendor?
- Is your item master clean, with no duplicate SKUs, outdated units of measure, or orphaned records still active?
- When last quarter's forecast missed, can someone explain why using data?
- Is your ERP system the actual system of record for inventory, or are there shadow spreadsheets filling in the gaps?
Most distributors we work with can answer “yes” to two or three of these on the first pass. That's normal, and it's the kind of situation an experienced implementation partner should help with before any forecasting model goes live.
A practical path forward: assess, pilot, expand
Most distributors don't stall on AI forecasting because the technology doesn't work. They stall because there's no sequence, no clear answer to “what do we actually do Monday morning.” A workable path has three phases.
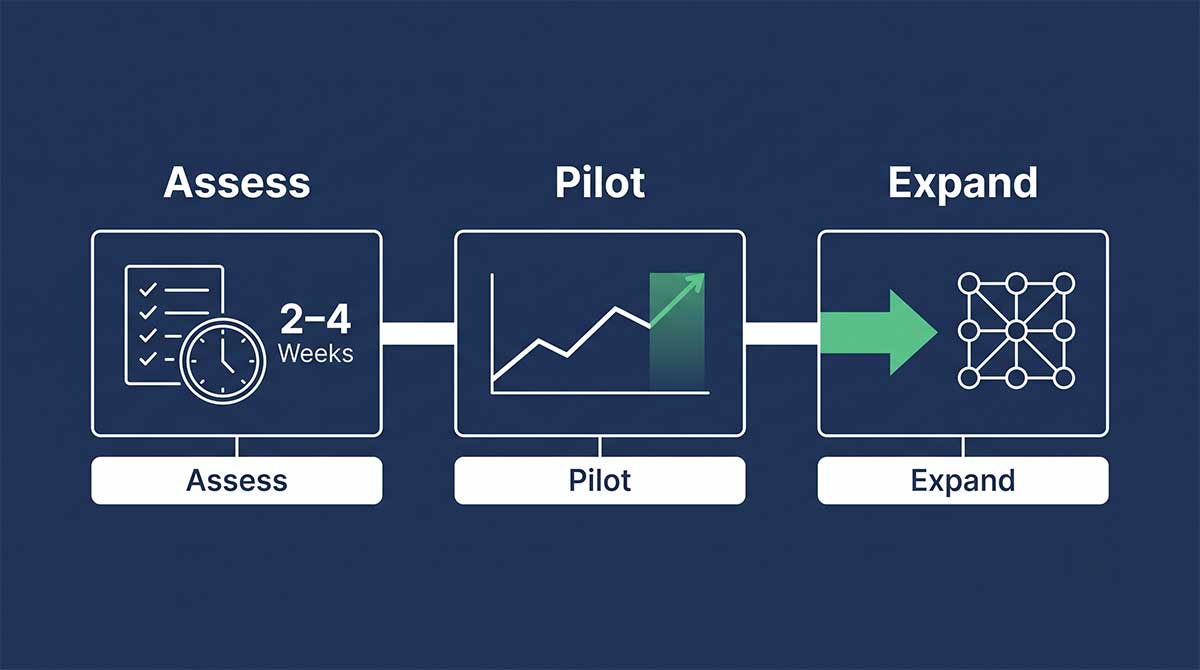
Phase 1: Assess (2–4 weeks)
- Run the data-readiness checklist above against your actual ERP and inventory data (be careful not to make assumptions but to base it on the actual data.)
- Identify the one or two product categories where forecasting errors cost you the most. Usually that's your highest-volatility or highest-margin lines.
- Agree with leadership on what success looks like before you start: consider things like a target reduction in carrying cost, a target improvement in fill rate, or a target reduction in expedited freight.
Phase 2: Pilot (one full demand cycle)
- Run the AI forecast alongside your existing planning process for one full demand cycle before switching over.
- Limit the pilot to the category identified in Phase 1. A contained pilot, done well, is what proves the case for budget to expand it. Resist the urge to roll it out everywhere at once.
- Review the model's exceptions weekly. This is also where your team learns to trust, or correctly question, what it's recommending, instead of treating it as a black box.
Phase 3: Expand
- Once the pilot hits its targets, extend to additional categories and locations using the same data-quality discipline that made the pilot work, not a rushed version of it.
- Build a retraining cadence into the process. Demand patterns shift with new competitors, new product lines, and market conditions, and a model that isn't periodically refreshed will quietly drift out of accuracy.
- Treat this as an ongoing capability, not a one-time project. The distributors seeing the largest gains are usually still refining their forecasting eighteen months after the first pilot, not declaring victory after Phase 1.
Frequently asked questions
How accurate is AI demand forecasting compared to traditional methods?
Across the research cited in this guide, AI-assisted forecasting commonly reduces forecast error by 20–50% compared with manual or spreadsheet-based methods, though the exact improvement depends heavily on how clean and complete your underlying data is. Distributors with strong data hygiene tend to land at the high end of that range; those starting from fragmented records should expect a slower ramp.
Does AI demand forecasting work for distributors with seasonal or project-based demand?
Yes. This is often where it adds the most value, because spreadsheet-based forecasting struggles most with demand concentrated in short windows or tied to project timelines rather than steady consumer buying patterns. AI models are specifically good at recognizing recurring patterns, like a seasonal spike or a contractor-driven order cycle, that a simple historical average will miss.
What does AI demand forecasting cost for a mid-market distributor?
Costs vary widely depending on whether you're adding a forecasting capability to your existing ERP system, licensing a standalone planning tool, or building something custom, and on how much data cleanup is required before any model can be trained reliably. Rather than quoting a number that won't hold up across different starting points, the more useful first step is the data-readiness assessment described above, which tells you how much groundwork your specific situation needs before technology cost even enters the conversation.
How long does it take to see results?
Most distributors see measurable improvement within one full demand cycle of a focused pilot, often three to six months depending on the product category. The first win is usually visible in reduced stockouts or reduced overstock on the pilot category, well before a broader rollout pays for itself.
Can AI demand forecasting work with our existing ERP system?
In most cases, yes. AI forecasting tools are generally designed to read from and write back to your existing ERP and inventory systems rather than replace them, so the forecasting engine changes while your system of record doesn't have to. The harder question usually isn't compatibility. It's whether the data inside your ERP is clean enough to train a reliable model, which is exactly what the checklist above is for.
Do we need a data science team to use AI demand forecasting?
No. Most distribution-focused forecasting tools are built for planners and operations staff to use directly, with the technical model-building happening behind the scenes. What you need is someone who understands your data well enough to get it ready, and someone who can interpret the exceptions the system flags, usually an extension of your existing planning team's role rather than a new hire.
Sources
- McKinsey & Company, “Harnessing the power of AI in distribution operations” (November 2024)
- McKinsey & Company research on distributor AI adoption sentiment and roadmap gaps (September 2024)
- NAW (National Association of Wholesaler-Distributors) and Modern Distribution Management, "In Pursuit of Value: Where 400+ Distributors Are Investing in AI Today" (2026)
Where to start
Kissinger Associates has spent four decades helping manufacturers and distributors get their ERP systems, and the data inside them, ready for exactly this kind of work. If you're not sure how your own data would hold up against the checklist above, that's a conversation worth having before you invest in any forecasting tool.
To pressure-test your own data before you invest, download our free Distribution ERP Evaluation Checklist, a vendor-neutral run through the inventory, EDI, eCommerce, financials, and implementation questions that determine whether a platform, and a forecasting layer on top of it, will actually work for your operation. If you’re weighing platforms, our Best ERP for Wholesale Distributors buyer’s guide compares Acumatica, Sage 100, and Sage Intacct for distribution and is direct about when each one is and is not the right fit. You can also see how we help wholesale and distribution businesses select, implement, and support the right system.


.svg)
.png)